
Why this matters
The VP of sales at a $15M sparkling-water brand gets the same quarterly package every brand gets: a Circana export, a trade-spend ledger with $1.8M against 14 promotions, and a board that wants to know which ones paid back. Somebody has to turn those files into an answer. The question of who can analyze promo data like this has five realistic answers, and they differ by an order of magnitude in cost and by weeks in turnaround.
Picking wrong is expensive in both directions. Hire a $95k analyst to produce a monthly promo recap and you bought a spreadsheet babysitter. Ask your broker for an incremental-lift analysis and you'll get last month's sell-in deck with a lift slide bolted on. This page maps the five options, what each one costs, and which questions each one can answer.
Who can analyze promo data: the five options
| Option | Cost shape | Turnaround | Best at |
|---|---|---|---|
| In-house analyst | Salary + data subscriptions | Days to a week | Institutional knowledge, always-on ownership |
| Broker / distributor team | Bundled into commission | A review cycle | Retailer context, sell-in support |
| Syndicated-data consultant | Hourly or per-project | 1–3 weeks | One-off complex questions, methodology you can defend to a CFO |
| TPM software | Annual license, plus implementation | Live, after setup | Planning, accruals, and deduction tracking across many events |
| AI-native analytics platform | Software subscription | Minutes, always-on | Complex post-promo math, repeated weekly, without a per-question fee |
Each row deserves a hard look, because the failure mode for every one of them is the same: it looks like coverage until the first genuinely hard question arrives.
In-house analyst
The default answer, and the right one when promo analysis is a weekly discipline rather than a quarterly panic. The analyst learns the brand's baselines, knows that the Sprouts TPR always pulls forward a week of pantry loading, and owns the number in the room. The catch is capacity: one analyst covering promo recaps, category reviews, and retailer decks does each of them at draft quality, and the promo math is usually where corners get cut. If the analyst is hand-building lift models in Excel, review the hidden cost of Excel-based reporting before assuming the salary is the whole cost.
Your broker or distributor
Brokers see more promotions than any brand does, and their retailer context is real. But their promo reporting answers the broker's question, which is whether the event supported the sell-in story, not the brand's question, which is whether the event created incremental profit. Broker lift numbers often do not correct for pull-forward, destocking, or the brand's own growth trend, and each of those corrections can move the answer by double digits. Use the broker's read as context, not as measurement.
That gap is closing for the brokers who care to close it. A broker running their book on the same data the brand sees can answer the brand's question rather than their own, and it is a real differentiator at renewal time. If you are the broker reading this, start with how to report across a multi-brand book.
Syndicated-data consultant
For a one-off, high-stakes question, a consultant who lives in Circana, SPINS, or NIQ data is often the fastest route to an answer a CFO will accept. Expect $150 to $300 an hour, a $3k to $10k engagement for a single promo deep dive, and one to three weeks of calendar time. The math they deliver is the same math described below; what you're paying for is methodology fluency and independence. The limit is cadence: at consultant rates, "rerun it for the next 14 promotions" is a budget line, not an email.
TPM software
Trade promotion management suites are built for the workflow around promotions: planning calendars, accrual tracking, deduction matching, settlement. Those are real problems, and a brand drowning in deductions should solve them. But most TPM tools measure a promotion by comparing actuals to plan, not by computing true incremental lift against a defensible baseline. If the question is "did this event beat what would have happened anyway," check whether the TPM report you have actually computes a baseline, because plan-vs-actual on its own does not answer it. See the broader trade promotion management overview for where TPM fits and where it stops.
AI-native analytics platform
The newest option, and the one built for exactly the question shape this page is about. An AI-native platform sits on harmonized syndicated and retailer data and computes lift across several baseline definitions at once, flags pull-forward and destocking windows, and reruns the whole analysis every week without a marginal cost per question. The evaluation criteria that separate a real AI-native tool from a chatbot bolted onto a dashboard are covered in AI-native vs bolted-on BI. The honest prerequisite: the data foundation has to be clean first, which is also true for every other option on this list.
How to choose: match the helper to the question
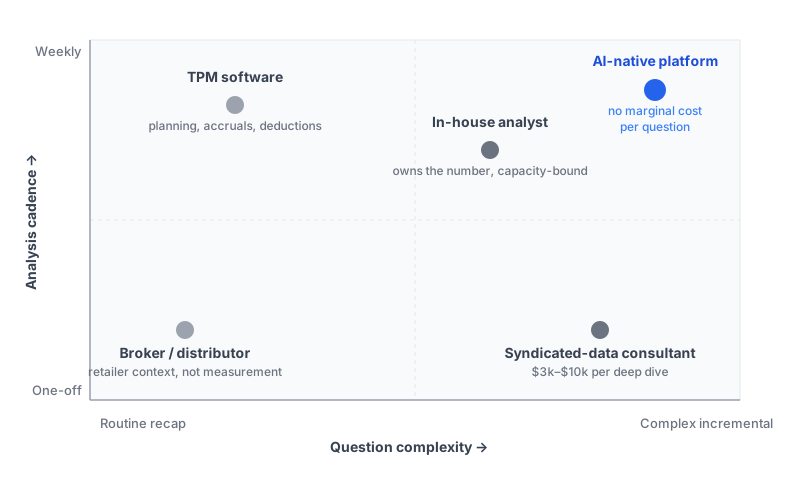
Two axes decide this: how complex the question is, and how often it recurs.
Routine and repeated, like a weekly promo recap against plan, stays in-house or in TPM software. Complex and one-off, like a make-or-break read on a $400k club-channel event, justifies a consultant. Complex and repeated, which is where most brands actually live once they run more than a handful of promotions a year, is the case for an in-house analyst equipped with an AI-native platform, because that combination is the only one on the list whose cost does not scale with the number of questions asked.
A useful forcing question for any option you're evaluating: ask the candidate, vendor, or agency how they would choose the baseline for a promotion on a brand growing 12% a year in a seasonal category. The right answer names the trade-offs between trailing windows, year-over-year, and trend adjustment, and explains that the choice can swing the lift number by 30-plus points. Anyone who answers "we compare to the prior four weeks" just told you the analysis will flatter every promotion a growing brand runs.
Six questions to ask before you hand over the data
Whichever option you're evaluating, the same six questions separate a team that can do complex promo analysis from one that produces recap slides. Ask them on the first call.
- "How do you pick the baseline?" The only acceptable answer names more than one method and explains when each applies. A single hardcoded method, whatever it is, means every promotion gets measured against the wrong yardstick some of the time.
- "How do you handle pull-forward and destocking?" If the answer is a blank look, the lift numbers will be 20 to 40 percent too generous in any pantry-stockable category. The correction requires weekly data around the event, so anyone working from 4-week or monthly aggregates cannot do it at all.
- "Do you report lift in dollars or in profit?" Revenue lift is the vanity version. A promotion that moves $128k of product at a deep discount can still lose money once margin and event costs land. Insist on ROI in gross-profit dollars.
- "What data do you need from us, in what shape?" A credible answer asks for weekly sales by item and retailer, the promo calendar with exact dates, total event cost including deductions, and unit margins. Anyone who says "just send what you have" is planning to guess.
- "What does the second analysis cost?" This is where the options diverge most. The consultant's second analysis costs another engagement. The analyst's costs another week. The platform's costs nothing. Match that marginal cost against how many promotions you run a year.
- "Can we audit the math?" Every number should decompose: baseline method, window, exclusions, corrections. A lift number that arrives as a bare percentage in a slide, with the workings hidden, is a number you cannot defend in a buyer meeting or a board meeting.
Brands that ask these six questions up front mostly discover that their current promo reporting, wherever it comes from, fails questions 1, 2, and 6. That is worth knowing before the next $1.8M of trade spend goes out the door.
What a complex promo analysis actually involves
Whoever does the work, complex promo analysis has the same six steps. This is the checklist to hold any of the five options against.
- Assemble the inputs. Weekly sales from Circana, SPINS, NIQ, or retailer POS portals; the promo calendar with exact dates; the full cost of the event including price support, feature fees, and deductions; and unit gross margin. Missing any one of these turns the analysis into guesswork.
- Pick the baseline deliberately. The single most consequential choice. Trailing 8 to 12 weeks for stable brands, trend-adjusted for growing ones, year-over-year for seasonal categories. Our baseline selection guide walks through a promo where the same event reads anywhere from +6% to +45% lift depending on this choice.
- Compute gross lift. Promo-period sales minus the baseline. In the worked example from the baseline guide, a $440k TPR week against a $312k trailing baseline reads as $128k of gross lift.
- Correct for borrowed sales. Subtract pre-promo pull-forward and the post-promo destocking trough. In that same example, $33k of pull-forward and $32k of destocking cut the genuine incremental to roughly $63k, half the headline.
- Convert to profit and ROI. Incremental units times unit gross margin, divided by total event cost. A $63k incremental at 35% margin is about $22k of gross profit; against a $45k event cost, that promo lost roughly half its spend even though the recap slide said +41% lift.
- Decide, then re-measure. The output is a decision: repeat, restructure, or kill the event. Brands that rank all their promotions this way typically find the bottom third fails to pay back, which matches the published industry range of 59% to 72% of promotions failing to break even.
The math is not exotic. What makes it "complex" in practice is that steps 2 and 4 require judgment and clean weekly data, and most recaps silently skip both.
Doing this in Scout
Scout is an AI-native analytics platform and consulting practice built for CPG brands, and complex promo analysis is its home turf. The platform harmonizes Circana, SPINS, NIQ, distributor, and retailer-portal data, then computes post-promo lift across several baseline definitions at once, with pull-forward and destocking windows as settings rather than separate spreadsheets. A brand manager can ask which of last quarter's promotions paid back and get the ranked answer, with the math visible, in minutes.
For brands that want expert humans on the problem, whether a one-time deep dive on a make-or-break event or standing up the whole measurement discipline, Scout's team does that work directly. Booking a working session at cpgscout.ai/consulting is the fastest way to get a complex promo or trade-spend question answered. Brands building the internal capability instead should start with the AI center of excellence guide, which covers how to structure the team so promo analysis becomes a repeatable function rather than a quarterly scramble.
Summary + further reading
- Five kinds of help can analyze promo data: in-house analysts, brokers, syndicated-data consultants, TPM software, and AI-native platforms. They differ by 10x in cost and by weeks in turnaround, and each fails quietly outside its lane.
- Match the helper to the question: consultants for complex one-offs, TPM for workflow, and an analyst plus an AI-native platform when complex promo questions recur, because that combination has no marginal cost per question.
- Hold any option to the six-step standard: real inputs, a deliberate baseline choice, pull-forward and destocking corrections, and ROI in profit dollars, not headline lift. The AI-native stack guide covers the tooling side of making that repeatable.