
Performance
See Where Growth Is Coming From
Continuously analyze performance by retailer, SKU, and region to show where to double down vs where to course-correct.
$63,540+18.2%

Sample data
Scout turns fragmented POS, syndicated, and retailer data into action: forecasting, replenishment, ordering, and promotions, for consumer brands and retailers.
Book a demo and see Scout run on your own data
Works with the retailers, distributors and panels you already sell through



Why Scout?
Performance
Continuously analyze performance by retailer, SKU, and region to show where to double down vs where to course-correct.
Sample data
Promotions
Understand what’s incremental, what’s subsidized, and which promos are driving velocity before your next decision. Instead of manually comparing SKU, banner, retailer, and time-period combinations, your team sees interesting anomalies in the data in seconds.

Sample data
Dashboards
Ask questions in plain English or build custom views with pre-built CPG templates. Sales, category, finance, and leadership each get the view they need without five competing versions of the truth.
Replenishment
Scout turns demand forecasts and live sell-through into the reorder quantities your team needs, ready for whoever places the order, before shelves run dry.
Sparkling Yuzu · 12oz
Northeast DC
Cold Brew Latte · 4pk
West region
Sea Salt Trail Mix · 8oz
Southeast DC
Oat Milk · 32oz
Midwest region
Sample data
Workflows
Six workflows built for CPG and retail: replenishment, promotions, white-space analysis, and competitive analysis, running on your data.
Turn daily, SKU-level and store-level signals into action: catch out-of-stocks early and trigger the replenishment moves that keep every product selling at your target velocity.
Streamline your supply chainTie promo spend to incrementality at the SKU and retailer level. Separate true lift from baseline, retention from one-time loading, and see which programs earn their dollars.
Optimize your trade spendForecast SKU-level demand at the retailer DC and store level, then generate the replenishment and purchase-order plan so the right quantity ships before you stock out.
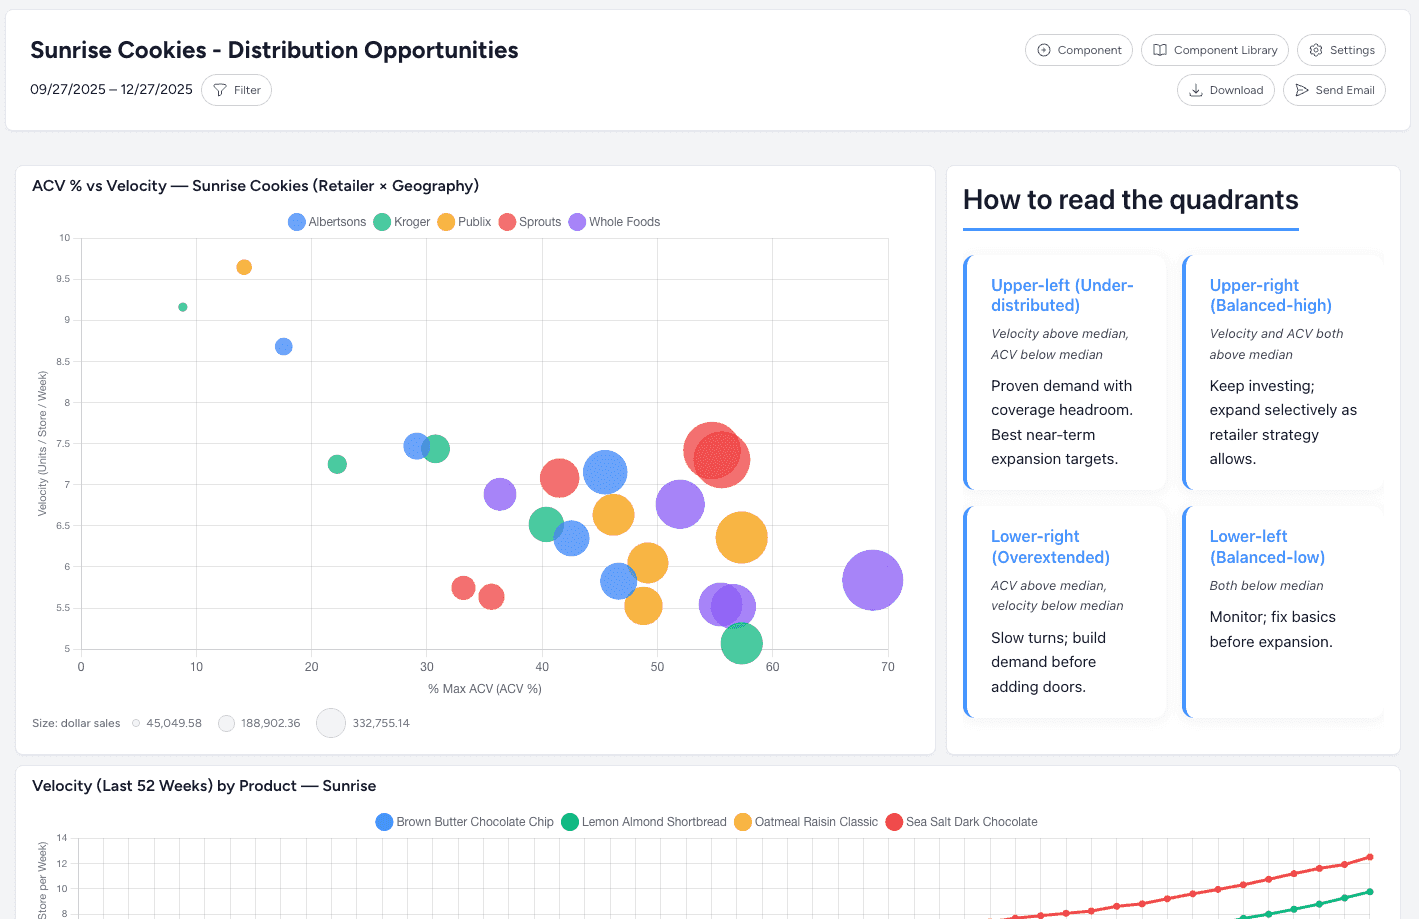
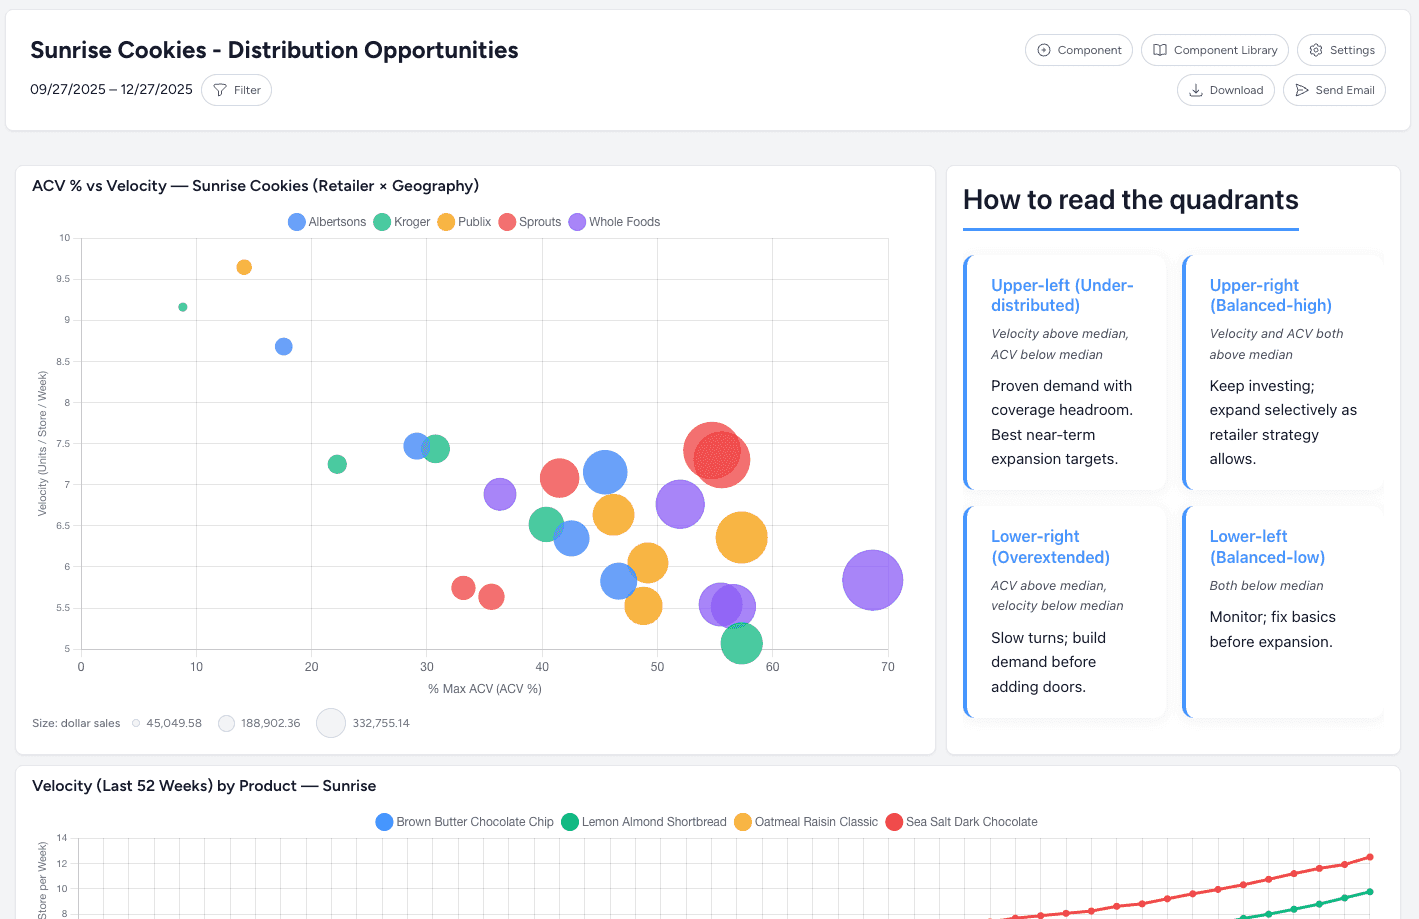
Forecast your demandIdentify distribution gaps and untapped opportunities across retailers, regions, and SKUs. See where your products aren't on shelf, and where they should be.
Find your white spaceTrack how your brand stacks up against competitors across price, velocity, distribution, and promo activity. Spot share shifts before they show up in the boardroom.
Benchmark your brandMonitor your e-commerce and omnichannel sales alongside brick-and-mortar. Understand which channels are driving incrementality and where to invest next.
Analyze your digital salesFeatures
Results
A sample of the work, across retailers and brands at different stages.
| Customer | What Scout did | Result |
|---|---|---|
| Regional grocery retailer, 40+ stores | Surfaced products selling well in some locations and not carried at all in others | Revenue up more than 2% |
| Specialty coffee roaster, natural channel | Automated category review prep across syndicated and retailer data | Review prep cut from days to hours |
| Better-for-you snack brand | Modeled deduction cost into trade spend before each promotion ran | Promotions priced on true net revenue instead of gross |
| Beverage brand, mass and club | Modeled post-promotion lift to separate incremental volume from baseline | Trade spend shifted onto the promotions that actually lift |
| Household goods brand, multi-retailer | Scored distribution gaps store by store across every retailer feed | Hundreds of store-level placement opportunities ranked by value |
“My data used to live in multiple tools, most of them clunky. Trade-spend reconciliation that took hours every week now takes fifteen minutes, and I spend that time making decisions instead of preparing data.”
What customers say
“Scout cut our category review prep time significantly and armed us with competitive insights that would not have been surfaced in our standard data review process.”
 Director of Sales· Heirloom Coffee Roasters
“This has shown me so many things about my stores I did not know before. Stocking a few products that were selling well in some locations and not carried at all in others has lifted our revenue by more than 2%.”
“We used to spend the week before every category review pulling numbers by hand. Now most of the deck is written before we sit down.”
“I asked a question the way I would ask a person, and got the answer with the rows behind it. My team stopped waiting on me to run reports.”
Data Inputs
Syndicated providers, retailer portals, distributors, store point-of-sale and back-office systems, and your own spreadsheets, all harmonized and ready to query. New integrations land continuously, so a source that is not on the list today is an onboarding conversation, not a dead end.
PDI Technologies
Back office and point of sale
Petrosoft Retail360
Back office and point of sale
CStoreOffice
Back office and point of sale
KeHE
Distributors and wholesalers
UNFI
Distributors and wholesalers
C&S
Distributors and wholesalers
Walmart
Retailer portals
Kroger 84.51
Retailer portals
Whole Foods
Retailer portals
Target
Retailer portals
Publix
Retailer portals
Costco
Retailer portals
Sprouts
Retailer portals
Wegmans
Retailer portals
SPINS
Syndicated panels
NielsenIQ
Syndicated panels
Circana
Syndicated panels
Spreadsheets
Whatever you already have
CSV and Excel exports
Whatever you already have
ERP and accounting
Whatever you already have
How it works


Connect your sales data from syndicated, retailer, and internal sources.

Scout harmonizes every format, forecasts demand, and generates the dashboards, plots, and tables behind each decision.

Trigger replenishment, ordering, and promo decisions the moment the data moves, not weeks later.
Pricing
Scout is an engagement, not a seat license. Every plan is quoted against your revenue level, so what you pay tracks what the data is worth to you.
Under $5Min revenue
For brands getting their first clean read on sell-through across retailers.
$5M to $50Min revenue
For teams running category reviews and trade promotions on a real cadence.
$50M and upin revenue
For organizations that need Scout to fit an existing stack and team.
Not sure which band you land in? We will tell you on the call.
Work as a broker? Scout for CPG brokers
FAQ’s
A 30-minute conversation to scope fit. Pick a time that works for you.