
The Cigarette Market: A C-Store Category Read
Tobacco is the largest merchandise category in most convenience stores and the one operators read least well. The cigarette market inside a store is not one line on a category report. It is three sets with different units, different margins and different directions of travel, and adding them into a single 'nicotine' number hides most of what a category read is for.
What follows is a category read built from inside-store transactions: unit velocity and pack mix across cigarettes, other tobacco products and nicotine pouches, how the price ladder moves, and what a tobacco transaction does to the rest of the basket. It says nothing about who buys or why, and nothing about health. Point-of-sale data cannot support either claim, and this page will not pretend otherwise.
Key takeaways
- Cigarettes have been losing share of inside sales steadily. NACS put the category at 30.9% of inside sales in 2015 and 18.8% in 2024, with other tobacco products moving the other way, 4.2% to 7.6%.
- A pack, a tin and a can are not comparable units. Any read that sums them is measuring nothing, and the fix is gross profit per store per week rather than a unit count.
- Price-tier migration shows up in dollars before it shows up in units. Watch blended gross profit per pack, not pack count, or you will find out a year late.
- A basket containing tobacco rings far higher than one that does not and delivers only slightly more gross profit. Both halves of that sentence are load-bearing.
- This is category analytics only. Transactions record what was sold, not who bought it, and nothing here should be read as a claim about consumers.
What the published cigarette market numbers cover
Start with the public benchmarks and the period each one actually covers, because the industry figures that circulate without a date are usually two or three years old by the time they reach a category review.
| Source | Figure | Period covered |
|---|---|---|
| NACS CSX convenience benchmarking database, published by NACS March 2026 | Cigarettes fell from 30.9% of inside sales to 18.8%; OTP rose from 4.2% to 7.6% | 2015 to 2024 |
| Same NACS CSX series | Monthly gross profit per store of $6,389 for cigarettes and $5,801 for OTP, at margins of 13.76% and 29.50% | 2024 |
| Same series, presented at the 2025 NACS Show | Monthly gross profit per store of $5,664 for cigarettes and $5,328 for OTP | Mid-2025 |
| NACS State of the Industry, announced April 2026 | US convenience in-store sales of $341.2 billion, up 1.7%, across 151,975 stores | 2025 |
| NACS industry update, 2025 NACS Show | Nicotine accounted for 27.9% of in-store merchandise transactions, packaged beverages 34.1%, beer 11.2% | Through June 2025 |
| Philip Morris International full-year results, released 6 February 2026 | ZYN US shipments of 794 million cans for the year, up nearly 37%, with 196 million cans in the fourth quarter | 2025 |
The pair worth sitting with is 13.76% and 29.50%. Those are the 2024 category margins NACS reported for cigarettes and OTP, and they are why the share shift is not a neutral rotation. A dollar of inside sales that moves from cigarettes to OTP carries roughly twice the gross profit with it. An operator watching only the cigarette line sees decline; an operator watching both sees a mix that is, on margin rate, improving.
Three sets, three units, one shelf
The single most common error in this category is arithmetic. Cigarettes sell in packs and cartons, OTP sells in tins, pouches, rolls and single cigars, and nicotine pouches sell in cans. A store that reports 'nicotine units down 4%' has added a 20-stick pack to a 15-pouch can and produced a number with no interpretation.
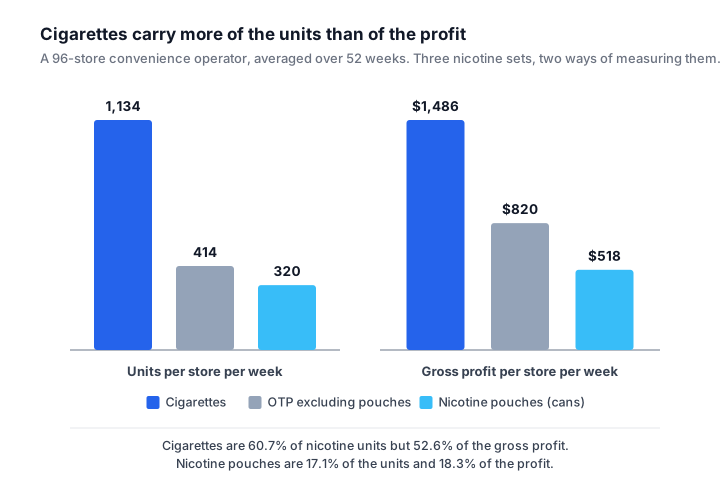
The unit that survives the comparison is gross profit per store per week, with the unit counts kept alongside it rather than merged into it. Here is that read for a 96-store convenience operator, averaged over 52 weeks. The example is calibrated so its cigarette and OTP lines land on the published NACS per-store gross profit, which means you can sanity-check its shape against a public benchmark before you trust the shape of your own.
| Set | Units per store per week | Average retail | Gross profit per unit | Gross profit per store per week |
|---|---|---|---|---|
| Cigarettes (packs and carton equivalents) | 1,134 | $9.42 | $1.31 | $1,486 |
| OTP excluding pouches (chew, cigars, snus) | 414 | $6.71 | $1.98 | $820 |
| Nicotine pouches (cans) | 320 | $5.79 | $1.62 | $518 |
| Total | 1,868 | $2,824 |
Read the two share columns against each other and the point falls out. Cigarettes are 60.7% of the units and 52.6% of the gross profit. Nicotine pouches are 17.1% of the units and 18.3% of the gross profit. The margin rates implied by the table are 13.9%, 29.5% and 28.0%, which is close enough to the published NACS figures for 2024 to be a useful check. Annualized, the cigarette line runs about $6,440 of gross profit per store per month against the $6,389 NACS reported for 2024, and the two OTP lines together run about $5,800 against a reported $5,801.
That last agreement is not a coincidence, because the example was built to land there. The reason to build it that way is that a category read you cannot benchmark is a category read you cannot defend, and the NACS CSX per-store gross profit series is the only public number in this category granular enough to check a store average against.
Price-tier migration, and why it hits dollars first
The cigarette set splits into three price tiers: premium, branded discount and deep discount. The tiers do not move at the same rate, and the mix between them is where a year of category gross profit quietly goes.
Same 96-store operator, cigarettes only, comparing a 52-week period against the 52 weeks before it.
| Price tier | Packs per store per week, prior year | Packs per store per week, current | Change in units | Share of packs, prior to current |
|---|---|---|---|---|
| Premium | 512 | 419 | Down 18% | 42.0% to 37.0% |
| Branded discount | 403 | 386 | Down 4% | 33.0% to 34.0% |
| Deep discount | 305 | 329 | Up 8% | 25.0% to 29.0% |
| Total | 1,220 | 1,134 | Down 7% |
Gross profit per pack across the three tiers ran $1.52, $1.30 and $1.04. Apply those to the mix and the blended figure falls from $1.33 to $1.31. That is two cents, which sounds like nothing until you multiply it out: cigarette gross profit per store per week goes from $1,623 to $1,486, a decline of 8.4% against a unit decline of 7.0%.
The gap between those two percentages is the whole finding. A category report that tracks packs alone shows a 7% problem. The actual problem is 8.4%, and the extra 1.4 points is mix, which is the part an operator can act on through the price ladder, the planogram and the promotional calendar. Tracking blended gross profit per pack alongside pack count turns a slow drift into something visible in a quarter rather than a year.
The same arithmetic runs on any category with a price ladder. It is the reason a retail price index built on the leading item in each tier is worth more than a single category average price, which moves for mix reasons and gets read as a pricing decision.
What tobacco does to the rest of the basket
This is the number a tobacco category review usually reaches for and usually gets half right. The claim is that tobacco drives the basket. The transactions support a narrower and more useful version.
Across the same 96 stores over a four-week window, 62,400 of 214,000 inside-store baskets contained at least one nicotine item, or 29.2%. That sits close to the 27.9% of in-store merchandise transactions NACS attributed to nicotine through June 2025, which is a reasonable indication the store set is not unusual.
| Basket type | Average ring | Blended gross margin | Gross profit per basket |
|---|---|---|---|
| Contains a nicotine item | $14.62 | 18.5% | $2.70 |
| No nicotine item | $8.95 | 27.3% | $2.44 |
The nicotine basket rings 63% higher and produces 11% more gross profit. Read the first number alone and tobacco looks like the engine of the store. Read both and it looks like what it is: a high-ring, low-rate category whose contribution is real but far smaller than its share of sales suggests.
The attachment cut is more actionable than the ring. In the same window, 41% of nicotine baskets also carried a packaged beverage against 33% of baskets without a nicotine item. That is a co-occurrence in a transaction and nothing more, but it is enough to justify testing adjacency between the nicotine fixture and the cold vault, which is a merchandising decision the data can support. See market basket analysis for the mechanics and attach rate for what the metric does and does not prove.
Pouches are a placement problem before they are a demand problem
Nicotine pouches are the fastest-moving part of this set and the part most often mis-measured, because their unit is small, their velocity is high and their fixture is usually an afterthought. Philip Morris International reported ZYN US shipments of 794 million cans for 2025, up nearly 37% on the prior year, with the brand holding around two-thirds of category value share.
A shipment number is not a velocity number, and the gap between them is where the store-level decision lives. In the worked example, pouches ran 320 cans per store per week at $5.79 and a 28.0% margin. That is 17.1% of nicotine units producing 18.3% of nicotine gross profit off a fixture that in most stores holds a fraction of the facings the cigarette set holds. Whether that is an opportunity depends on the space-to-sales index at your own stores, not on a national growth rate.
Two measurement traps here are worth naming. First, pouch counts vary by can, so a can-level unit read is comparable across the set only if every item is in the same count, and the item file usually says so. Second, pouch items turn over faster than the pricebook does, and a new item selling at an inherited retail is a margin leak that reads as strong velocity. An audit of the tobacco set against the retail pricebook usually finds a handful.
What this read cannot tell you
A transaction records an item, a price, a time and the other items in the basket. It does not record a person. So a first-party tobacco read supports velocity, pack mix, price-tier migration, seasonality, store-to-store comparison and basket composition, and it supports none of the following: who buys the category, how old they are, why they switched tiers, or anything at all about health outcomes.
Those questions need a loyalty-linked panel or a survey, and a category report that answers them from POS alone is inventing. This matters more in tobacco than in most categories, because the vocabulary of the category invites the slip: 'the premium smoker is trading down' is a sentence about people written from a table about packs. The defensible version is 'premium packs fell 18% while deep discount rose 8%', which is what the data says and is enough to act on.
A short checklist for the next tobacco category review
- Report the three sets separately, in their own units, with gross profit per store per week as the comparable line.
- Put blended gross profit per pack next to pack count for cigarettes, so mix movement is visible without a special analysis.
- Index space against dollars for each set. A category whose facings share badly exceeds its gross profit share is a reset conversation, not a pricing one.
- Reconcile the tobacco set against the pricebook every reset. New OTP and pouch items are where inherited retails hide.
- Benchmark store to store before benchmarking against the industry. A national share figure cannot tell you which of your stores is the outlier.
How Scout fits
Scout reads inside-store POS directly, so the three nicotine sets, their units, their price tiers and the baskets they appear in sit in one model rather than in three exports that have to be reconciled by hand. That is what makes the gross-profit-per-pack line above a standing view instead of a quarterly project, and it is why mix movement surfaces in weeks rather than at the next category review.
One boundary, stated plainly. For fuel operators Scout reads the forecourt as well as the inside store, but the two are separate instruments: every number on this page is a merchandise number, not a fuel one, and the pair should not be quoted as one series. Ordering is no longer a boundary: Scout can hold the item file, maintain cost and retail, push a price file to the POS, and raise and transmit the purchase order against the order guide it holds.
Related: beverage industry trends, the convenience store back office, and daypart.
Frequently asked questions
- Is the cigarette market still the biggest c-store category?
- Nicotine as a whole remains the largest merchandise group in most stores, but cigarettes alone have been shrinking as a share of inside sales for a decade. NACS reported the category at 30.9% of inside sales in 2015 and 18.8% in 2024, with other tobacco products rising from 4.2% to 7.6% over the same period.
- How should cigarettes, OTP and nicotine pouches be compared?
- Not by unit count. A pack, a tin and a can are different quantities of different things. Compare gross profit per store per week, keep the unit counts alongside as a velocity check, and index each set's facings against its gross profit share when you are deciding space.
- Why does cigarette gross profit fall faster than cigarette units?
- Because the mix moves down the price ladder while the total is still holding. In the worked example above, packs fell 7.0% but gross profit fell 8.4%, and the extra 1.4 points came entirely from premium losing share to deep discount. Tracking blended gross profit per pack makes that visible early.
- Does a tobacco purchase really drive the rest of the basket?
- It rings higher, by a lot, and it contributes more gross profit, by a little. In the worked example the nicotine basket rang 63% above the non-nicotine basket and produced 11% more gross profit, because the category's margin rate is roughly nine points lower. Both numbers belong in the review.
- Can POS data tell you who is buying tobacco?
- No. Point-of-sale data records items, prices, times and baskets, not people. Demographic or attitudinal claims need loyalty-linked data or a survey, and a category report that infers them from transactions alone is not supportable.
See this on your own data
Scout gives CPG sales teams the analytics infrastructure they need, without spreadsheets.
Get a 15-min demoGet posts like this in your inbox
Retail data, trade promotion, and category management for CPG teams. Roughly weekly. Unsubscribe any time.