
Confectionery Industry: The Candy Velocity Read
The confectionery industry runs on four weeks of the year and gets planned as if it runs on fifty-two. Candy is the most seasonal set most retailers carry, the season builds over about eight weeks and collapses in one, and the difference between a good candy year and a bad one is usually decided in the seven days after Halloween rather than in the ten before it.
This is the candy read from transactions: the seasonality curve week by week, what checkout placement does to the same item, and where the pack and price-tier mix quietly moves the margin. The published category figures come first, with their sources and their periods, because they are useful for framing and useless for ordering.
Key takeaways
- The seasonal build takes about eight weeks and the collapse takes one. Ordering against a trailing average will overshoot on the way down every single year.
- The week after Halloween is where the season's margin is decided, not the week of it. That is when promoted share peaks and average retail falls hardest.
- Placement, not the item, explains most velocity differences in candy. The same pack at checkout and in the aisle are two different products commercially.
- The pack carrying the most dollars carries the lowest margin rate. Read the candy set in gross profit, not in sales.
- Candy sits in the top tier of margin rate for a c-store or grocery merchandise set, which is why space arguments here are usually winnable on profit even when they lose on sales.
What the published confectionery industry numbers cover
Take framing figures from named sources with stated periods, and drop anything that arrives as a market size with a growth rate and no methodology.
| Source | Figure | Period covered |
|---|---|---|
| National Confectioners Association, 2026 State of Treating, released 10 March 2026, built on Circana and Euromonitor data plus an NCA consumer survey | US confectionery sales of $55 billion, projected to reach $62.2 billion by 2030 | 2025, with a 2030 projection |
| Same report | Chocolate 51.7% of confectionery sales, non-chocolate candy 40.9%, gum and mints the balance; 99.8% of households bought confectionery at least once | 2025 |
| Same report | The four big candy seasons, Valentine's Day, Easter, Halloween and the winter holidays, accounted for 63% of all confectionery sales | 2025 |
| NACS Magazine, June 2026, citing the NACS State of the Industry Report of 2025 Data and Circana-measured outlets | Convenience accounted for nearly 16% of candy category sales; chocolate was 34.5% of the c-store candy set; chocolate dollars grew nearly 7% while units fell 1.5% | 2025 |
| National Retail Federation consumer survey with Prosper Insights, fielded 2 to 9 September 2025, 8,045 respondents | Record Halloween spending of $13.1 billion, of which candy was $3.9 billion, at $114.45 per person, with 73% of consumers planning to celebrate | Halloween 2025 |
| NACS State of the Industry Summit, reported June 2026 | 435 new candy and salty snack items introduced during the year | 2025 |
One pair of numbers in that table is the whole category in miniature: chocolate dollars grew nearly 7% in 2025 while chocolate units fell 1.5%. Growth in candy right now is price. A category review that reports dollars and stops has reported inflation and called it demand.
The seasonality curve, measured week by week
Here is the read that makes candy orderable, and it is one that only store-level transactions produce: units per store per week indexed against the set's own 52-week average, running into and out of the season. A 148-store grocery and convenience operator, total candy set, with week 0 being the week containing 31 October. The 52-week average is 412 units per store per week.
| Week | Units per store per week | Index against the 52-week average | Share of units on promotion | Average unit retail |
|---|---|---|---|---|
| Week minus 8 | 447 | 1.08 | 31% | $2.34 |
| Week minus 6 | 512 | 1.24 | 36% | $2.41 |
| Week minus 4 | 703 | 1.71 | 45% | $2.62 |
| Week minus 2 | 1,108 | 2.69 | 58% | $2.71 |
| Week minus 1 | 1,642 | 3.99 | 61% | $2.66 |
| Week 0, Halloween week | 1,913 | 4.64 | 57% | $2.44 |
| Week plus 1 | 604 | 1.47 | 74% | $1.71 |
| Week plus 2 | 388 | 0.94 | 52% | $1.94 |
| Week plus 4 | 401 | 0.97 | 33% | $2.29 |
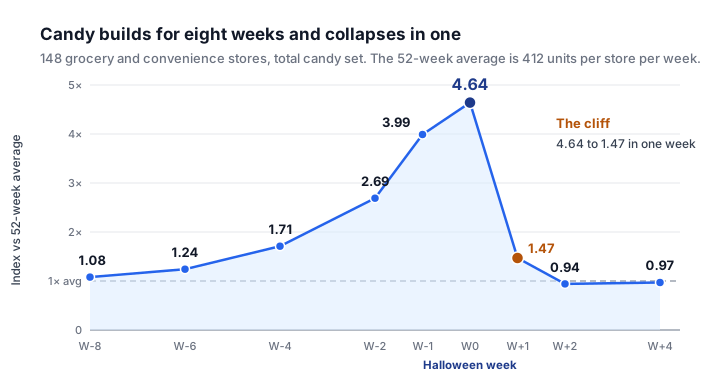
Read the shape rather than the peak. The set climbs for eight weeks to 4.64 times its own baseline, and one week later it is at 1.47 and falling. By week plus 2 the category is below its ordinary run rate. Across the eleven weeks from week minus 8 to week plus 2 the set sold 8,940 units per store against a baseline expectation of 4,532, so 4,408 units, 49% of the period's volume, were seasonal.
Now look at the two right-hand columns in week plus 1. Promoted share peaks at 74%, higher than any week of the build, and average retail falls to $1.71, which is 30% below the $2.44 of Halloween week itself. Week 0 sells 1,913 units at $2.44, or $4,668 per store. Week plus 1 sells 604 units at $1.71, or $1,033. That week is not a sales week, it is a liquidation week, and how much inventory reaches it is decided by an order placed three to four weeks earlier.
Which gives the ordering rule the curve implies. Order to the leading edge on the way up, because the build is steep enough that a trailing average is always a week behind. Then stop early on the way down, because the fall is a cliff rather than a slope, and every unit that arrives after week 0 is a markdown waiting to happen. How to prevent over-ordering in retail covers the general method, and reduce overstock covers what to do when the order has already landed.
Two cautions on the curve itself. It is store-set specific: a highway travel center and an urban grocery have different peaks and different collapse rates, so run it by format rather than for the chain. And the calendar moves, because Halloween falls on a different weekday each year and the trailing weekend is a real part of the peak. Aligning the curve on the day rather than on the ISO week is worth the extra work. The season-level view, including how far the season start has crept and what the promo build looks like across three seasons, is in Halloween candy trends.
Checkout against aisle: the same item, two different products
The most common misreading in candy is treating an item's velocity as a property of the item. It is mostly a property of the fixture.
Same 148 stores, the singles and changemaker segment, comparing the items merchandised on the front-end fixture against the same 34 items in the main aisle set.
| Placement | Items | Units per store per week | Average retail | Gross margin | Gross profit per store per week |
|---|---|---|---|---|---|
| Front-end checkout fixture | 34 | 189 | $1.63 | 51.4% | $158 |
| Main aisle set | 34 | 61 | $1.58 | 49.8% | $48 |
Same items, 3.1 times the units and 3.3 times the gross profit, on a price difference of five cents. Any velocity comparison in candy that does not segment by placement will tell you an item is failing when the fixture was the variable, and any new-item test run in the aisle and judged against a checkout benchmark is rigged before it starts.
The operational consequence is that the checkout fixture is the scarcest space in the store and should be allocated on gross profit per facing per week rather than on brand relationships or on a national velocity ranking. It is also the place where planogram compliance actually pays: a front-end that has drifted from its layout is losing three times the volume per missing item that an aisle gap loses.
Pack and price-tier mix, and where the margin hides
The candy set is really five sets with different jobs. Here is the 52-week average for the same operator, at 412 units and $1,412 per store per week.
| Pack type | Items | Units per store per week | Average retail | Dollars per store per week | Gross margin |
|---|---|---|---|---|---|
| Singles and changemaker | 62 | 137 | $1.71 | $234 | 58.0% |
| King size | 41 | 88 | $2.98 | $262 | 52.0% |
| Share pack and laydown bag | 55 | 95 | $4.29 | $408 | 48.5% |
| Theater box and novelty | 28 | 40 | $2.14 | $86 | 60.0% |
| Seasonal bulk bag | 24 | 52 | $8.12 | $422 | 43.5% |
| Total | 210 | 412 | $1,412 | 49.9% blended |
The set turns $705 of gross profit per store per week at a blended 49.9%, which is consistent with the 50%-plus margin rate the trade press reports for candy in convenience. But the ranking flips depending on the column you read. Seasonal bulk bags are 12.6% of units and 29.9% of dollars, the largest dollar line in the set, and they carry the lowest margin rate in it. Singles are 33.3% of units and 16.6% of dollars and carry the second-highest rate.
So a candy plan built on dollars will chase bulk bags into the season and give away rate; a plan built on units will over-weight singles and under-fund the season. The line that resolves it is gross profit per store per week by pack type, which is the only column in that table that ranks the packs by what they actually contribute. On that ranking the share pack and the seasonal bulk bag are still the top two, at $198 and $184, but the gap down to king size and singles, both at $136, is far narrower than the dollar column suggests.
One more mix note worth carrying into a line review. NACS reported 435 new candy and salty snack items introduced in 2025, against a candy set of roughly 200 items in a typical store. The set cannot absorb that rate of introduction, so every authorization is a substitution, and the honest new-item test is net dollars for the whole set rather than the new item's own velocity. Product cannibalization has the method.
What the confectionery read cannot tell you
Transactions record items, prices, times and baskets. They do not record people. So a first-party candy read supports velocity, pack mix, price-tier movement, seasonality, placement comparison and basket composition, and supports none of the following: who bought the category, how much anyone consumed, or why a pack was chosen.
That matters here because the seasonal press is full of consumption claims, and the vocabulary makes the slip natural. The NRF figure above is a survey of stated spending intentions, not a measurement of purchases, and it is quoted here as exactly that. The defensible sentence from POS is 'units per store per week peaked at 4.64 times baseline in the week containing 31 October'. Anything about who was buying or what happened to the candy afterwards needs a different instrument.
A candy season checklist
- Build the curve from your own stores, by format, aligned on the calendar date rather than the ISO week.
- Set the last inbound order date against week 0, not against a trailing average, and treat the week after as a markdown plan rather than a sales plan.
- Report checkout and aisle separately for every shared item, always.
- Rank pack types by gross profit per store per week, and check that ranking against the dollar ranking before agreeing a space change.
- Split dollar growth into price and units. In this category most recent growth has been price, and a plan that assumes otherwise will over-order.
How Scout fits
Scout reads store-level POS directly and holds placement, pack, price, promotion and margin in one model, so the seasonality curve, the checkout-against-aisle split and the pack-type profit ranking are standing views rather than three separate spreadsheet rebuilds every autumn. Scout also produces store-level order recommendations and flags over-ordering from sell-through against orders, which in a category with a one-week cliff is where the money is.
The boundary. Scout can hold the item file, maintain cost and retail, push a price file to the POS, and raise and transmit the purchase order against the order guide it holds, so ordering is not the line it used to be. What still needs care is fuel: Scout reads the forecourt as well as the inside store, every figure here is a merchandise number rather than a fuel one, and the two should not be blended.
Related: tentpole events and the convenience store back office.
Frequently asked questions
- How big is the US confectionery industry?
- The National Confectioners Association reported $55 billion in US confectionery sales for 2025 in its 2026 State of Treating report, released 10 March 2026 and built on Circana and Euromonitor data, with a projection of $62.2 billion by 2030. Chocolate was 51.7% of sales and non-chocolate candy 40.9%.
- How seasonal is candy, exactly?
- Very. The NCA reported that the four big seasons accounted for 63% of all confectionery sales in 2025. At store level the Halloween curve in the worked example above peaked at 4.64 times the set's own 52-week average, then fell to 1.47 times one week later and below baseline the week after that.
- When should a retailer stop ordering candy before Halloween?
- Earlier than the trailing average suggests. Because the build takes about eight weeks and the collapse takes one, an order placed on a rolling four-week rate in the final fortnight lands into a week where promoted share peaks near three quarters of units and average retail drops around 30%. Set the last inbound date against the peak week, not against recent sales.
- Why does the same candy item sell so much better at checkout?
- Because the fixture, not the item, is doing the work. In the worked example the same 34 singles items sold 3.1 times the units and 3.3 times the gross profit on the front-end fixture as in the main aisle, on a five-cent price difference. Any candy velocity comparison that ignores placement is measuring the fixture.
- Is candy a high-margin category?
- Yes, among the highest in a merchandise set. The worked example blends to 49.9% across five pack types, consistent with the 50%-plus rate the trade press reports for convenience. Within the set the rate falls as pack size rises, so the bulk seasonal bag brings the most dollars and the least rate.
See this on your own data
Scout gives CPG sales teams the analytics infrastructure they need, without spreadsheets.
Get a 15-min demoGet posts like this in your inbox
Retail data, trade promotion, and category management for CPG teams. Roughly weekly. Unsubscribe any time.