
Halloween Candy Trends: The Season's Real Shape
Halloween candy trends get published every September as a list of the flavours that are up, and every one of those lists lands weeks after the orders that decided the season were written. The useful read is the shape of the season: when it starts, how the mix moves, which pack carries the dollars, and how deep the discount goes week by week.
That shape has been moving. In the store set below the season opens four weeks earlier than it did two years ago, chocolate has given up six and a half points of seasonal share, and the discount depth in the final fortnight is more than double the depth of the opening weeks. The week-by-week velocity curve, and the markdown arithmetic of the week after Halloween, live on the confectionery industry read. This page is the part that curve does not show.
Key takeaways
- The season starts earlier every year and the peak does not move, so the selling window lengthens from the front. In the worked example below the set went live four weeks earlier over two seasons.
- That start creep silently breaks year-over-year season-to-date reporting. The same two seasons read at the end of August looked like plus 58% and finished at plus 7.4%.
- Chocolate is losing seasonal share to gummy and to its own shelf price. Seasonal chocolate dollars fell 4.6% while its units fell 17.4%, so the gap is price.
- The pack that carries the season carries the worst margin rate. The fun-size variety bag is 46% of seasonal dollars at a 39.5% rate; the theater box is 13.4% of dollars at 56.5%.
- Promotional depth roughly doubles across the build, from about 12% off in the opening weeks to about 27% in the final fortnight. A deal costed at the opening depth is under-funded by the time it runs.
What the published Halloween candy trends numbers measure
Framing figures are useful for a line review and useless for an order. Take them with their source, their universe and their period attached, and notice how often two of them describe opposite things.
| Source | Figure | Period and universe |
|---|---|---|
| Circana Point of Sale, total US multi-outlet, reported by FoodNavigator on 23 September 2025 | Total candy dollars up 3.1% to $40 billion with units down 1.6%. Chocolate and non-chocolate each grew dollars 3.1%, with units down 1.7% and 1.0% | 52 weeks ending 13 July 2025 |
| Circana seasonal read, reported by Food Dive on 28 October 2025 | Non-chocolate seasonal Halloween candy pound sales up 4.5%; seasonal chocolate down 13.7%; sales of smaller-size Halloween chocolates up against the prior year | Eight weeks ending 14 September 2025 |
| National Confectioners Association, cited in the same Food Dive report | US Halloween candy retail sales of $7.4 billion, up 2.2% on the prior year | Halloween 2024 |
| Mars, from an Ipsos online survey of 3,000 US adults, 2,406 of them Halloween celebrants, released 21 July 2025 | One in five celebrants plan two months or more ahead, and those early planners are nearly three times more likely to buy Halloween candy the moment it appears | Fielded April 2025 |
Two rows of that table disagree, and the disagreement is the finding. On the full-year national read chocolate and non-chocolate grew at the same 3.1% rate. On the eight-week seasonal read they moved in opposite directions, chocolate pounds down 13.7% against non-chocolate up 4.5%. Seasonal candy is not the candy aisle in miniature. It is a different item set with a different price behaviour, and a category review that reads the annual number onto the season will be wrong in the direction that costs money.
The Mars figure is a stated intention, not a purchase. It is a reason to look for early buying in your own register, not evidence that it happened.
The season starts earlier every year, and that breaks the comparison
Here is the read that made this page necessary. A 96-store grocery and convenience operator, the seasonal Halloween candy item set only, three completed seasons. Week numbers count back from the week containing 31 October.
| Season | First week the seasonal set scans in more than half the stores | First week seasonal clears 5% of candy dollars | First week it clears 25% | Seasonal dollars per store, whole season |
|---|---|---|---|---|
| Three seasons ago | Week minus 10 | Week minus 8 | Week minus 4 | $9,140 |
| Two seasons ago | Week minus 12 | Week minus 10 | Week minus 5 | $9,880 |
| Last season | Week minus 14 | Week minus 11 | Week minus 5 | $10,610 |
The set went live four weeks earlier across two seasons, and week minus 14 is the last week of July. The 5% crossing moved three weeks earlier, the 25% crossing one week, and the peak did not move at all, because the peak is nailed to a date on the calendar while the start is a merchandising decision. The window is lengthening from the front only, and the added weeks are low-rate weeks.
Now the expensive consequence. Season to date at week minus 9, which for most operators is the last week of August and the week the first reorder gets written:
| Measure | Two seasons ago | Last season | Change |
|---|---|---|---|
| Seasonal dollars per store, season to date at week minus 9 | $1,090 | $1,720 | +57.8% |
| Seasonal dollars per store, full season | $9,880 | $10,610 | +7.4% |
Same stores, same items, same two seasons. Read at the end of August the category was up 58%. It finished up 7.4%. The 50-point gap is not demand. It is two extra weeks of shelf presence sitting inside one side of the comparison, and a reorder written against the first number buys most of a second season it will never sell at full price.
The fix costs nothing. Align the comparison on the set's own start week rather than on the calendar. Six weeks after the set went live, which is week minus 6 in the earlier season and week minus 8 in the later one, seasonal dollars per store were $2,980 and $3,140. That is plus 5.4%, within two points of where the season finished. One of those numbers is a signal and the other is an artifact of a planogram date, and the same report produces both. Retail seasonal planning holds the rest of the calendar to the same standard.
Chocolate, gummy and better-for-you: the mix moved, the units did not
Same operator, seasonal item set only, last season against two seasons ago, stated per store for the whole season.
| Seasonal segment | Dollars per store, two seasons ago | Dollars per store, last season | Units per store, two seasons ago | Units per store, last season |
|---|---|---|---|---|
| Seasonal chocolate | $5,770 | $5,506 | 1,187 | 981 |
| Gummy and chewy | $2,529 | $3,268 | 680 | 849 |
| Hard candy, lollipop and candy corn | $1,255 | $1,284 | 427 | 421 |
| No-sugar-added and reduced-sugar | $326 | $552 | 62 | 101 |
| Total seasonal set | $9,880 | $10,610 | 2,356 | 2,352 |
Start at the bottom row. Seasonal dollars grew 7.4% and seasonal units fell 0.2%. The whole of last season's growth was price, in a set the operator ordered against a dollar plan. That is the same shape Circana reported nationally for the full candy category, dollars up 3.1% and units down 1.6%, arrived at from a completely different universe.
Then read the segments. Seasonal chocolate lost 4.6% of dollars and 17.4% of units, because its average selling price went from $4.86 to $5.61, up 15.5%. Gummy and chewy gained 29.2% of dollars on 24.9% more units at an average price that moved only from $3.72 to $3.85. Chocolate's share of seasonal dollars fell from 58.4% to 51.9% while gummy went from 25.6% to 30.8%. Hard candy and candy corn held flat on both counts, which is what a genuinely stable segment looks like and is worth knowing so you stop reforecasting it.
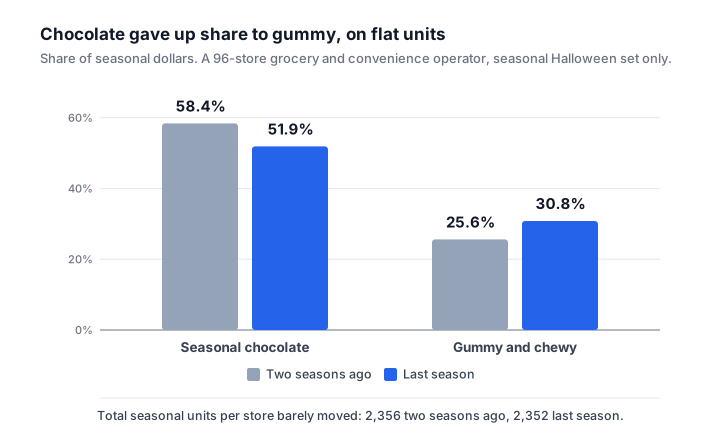
The no-sugar-added and reduced-sugar line is the one people over-read. It grew 69.3% in dollars and 62.9% in units, the fastest rate in the table, and it is still 5.2% of seasonal dollars against 3.3%. At 101 units per store across a whole season, roughly two units a store a week during the build, it earns a small permanent presence rather than a seasonal expansion.
One caution on the chocolate line. A 15.5% price move over two seasons is close to what the commodity did, so most of it is cost passed through rather than a mix trade up. Split it before acting: run the same table at last season's prices on both years, and whatever remains is real trading behaviour. Everything else is the cocoa market wearing a category costume.
Pack format is where the season's margin is set
The seasonal set is four commercial jobs pretending to be one category. Last season, same operator, per store for the season.
| Pack format | Dollars per store | Units per store | Average retail | Gross margin | Gross profit per store |
|---|---|---|---|---|---|
| Fun-size variety bag | $4,880 | 604 | $8.08 | 39.5% | $1,928 |
| Single-flavor laydown bag | $2,910 | 585 | $4.97 | 44.0% | $1,280 |
| Theater box and boxed novelty | $1,420 | 726 | $1.96 | 56.5% | $802 |
| King size and singles in seasonal graphics | $1,400 | 437 | $3.20 | 51.0% | $714 |
| Total seasonal set | $10,610 | 2,352 | $4.51 | 44.5% | $4,724 |
The fun-size variety bag is 46.0% of seasonal dollars at the lowest margin rate in the set. The theater box is 13.4% of dollars at the highest rate, and it moves the most units of any format at $1.96 a unit. Ranked on gross profit the top order is unchanged, $1,928 against $1,280, but the theater box's lead over the seasonal king size widens from $20 of sales to $88 of gross profit.
The reason to hold this table rather than a sales ranking is what happens to each format on 1 November. The variety bag is unsellable at regular retail the moment the season ends, so its dollars are the ones exposed to markdown, while the theater box and the seasonally printed king size revert to ordinary items. The format carrying 46.0% of the season is the one you can least afford to be long on, and the two carrying 26.6% between them survive the date. That is an argument about which line to order tight, not which to cut.
Circana's read that smaller-size Halloween chocolate grew while seasonal chocolate pounds fell 13.7% points the same way: the pack ladder is absorbing the price move. If the count per variety bag has come down while the shelf price held, you have taken a price increase without a price change, and only a per-unit read will show it. Price pack architecture is the frame; equivalized volume is how you compare a 30-count bag to a 60-count one.
Promotional depth roughly doubles across the build
Promoted share of units is the number most reports carry, and it is the less interesting half. Depth is the other half: how far off regular retail the promoted units actually rang. Same operator, same seasonal set, last season, by phase of the build.
| Phase | Share of seasonal dollars sold on promotion | Average depth off regular retail | Dominant mechanic |
|---|---|---|---|
| Weeks minus 14 to minus 11 | 18% | 12% | Single-item shelf reduction |
| Weeks minus 10 to minus 8 | 27% | 15% | Single-item shelf reduction |
| Weeks minus 7 to minus 5 | 41% | 19% | Multi-buy, two for a fixed price |
| Weeks minus 4 to minus 3 | 56% | 23% | Multi-buy plus feature |
| Weeks minus 2 to minus 1 | 68% | 27% | Feature and display |
| Week 0, Halloween week | 63% | 25% | Feature and display |
Depth more than doubles from the opening phase to the final fortnight, and the mechanic changes underneath it. That has a measurement consequence before it has a money one: an item's promoted velocity in week minus 12 and in week minus 2 are not the same measurement. One is a shelf reduction on a single item in a quiet store, the other a multi-buy on a display in the busiest week of the category. A new item tested in the opening phase against a benchmark set in the final fortnight fails before it ships.
The money consequence. Across the whole build, 52% of seasonal dollars sold on promotion at a dollar-weighted depth of 24%, which sits near the late-week numbers because the late weeks carry most of the volume. That is $5,517 of promoted dollars per store, which would have rung $7,259 at regular retail. The season gave back $1,742 per store, 16.4% of seasonal dollars.
Now price the planning error. A promotional plan written in June against the opening depth of 15% would have forecast a giveaway of $974 per store. The season delivered $1,742. The gap is $768 a store, about $74,000 across the 96 stores, and none of it shows up as a variance because every individual promotion ran exactly as agreed. Depth-weight the plan by week and the number stops being a surprise. Evaluating promotions has the general method, and multiple unit pricing covers what the mechanic change does to the arithmetic.
What a Halloween candy trends read cannot tell you
Transactions record items, prices, times, stores and baskets. They do not record people. So this read supports the season's start date, mix, pack economics, promotional depth and basket composition, and it supports none of the following: who bought the candy, how old they were, whether they had children, whether the candy was eaten or handed out, or why they chose the bag they chose.
Halloween is where that line gets crossed most often, because the seasonal press is written in the language of consumption. The defensible sentence from a register is 'seasonal dollars reached 5% of the candy category in week minus 11 last season against week minus 10 two seasons before'. Anything about the shopper needs loyalty-linked demographics or a panel, and the honest version of that answer names which one you used.
A pre-season checklist
- Date the season from your own register, not from the vendor calendar. The week the set crosses 5% of category dollars is the start; write it down every year so next year's comparison has an anchor.
- Rebuild every year-over-year season-to-date report on weeks since the set went live. A calendar-aligned comparison in August is measuring a planogram date.
- Split seasonal dollar growth into price and units before the order goes in. If units are flat, the plan is a price plan and the volume assumption behind the order is wrong.
- Rank pack formats on gross profit and then re-rank them on markdown exposure. The variety bag usually tops the first list and the second.
- Cost the promotional plan at the depth each week actually runs, not at the depth of the opening offer. The difference is real money and it does not appear as a variance anywhere.
How Scout fits
Scout reads store-level point of sale directly and holds item, pack, price, promotion, placement and margin in one model, so a seasonal set can be dated from its own first scan, compared on weeks-since-live, and split by pack format and promotional depth without three spreadsheet rebuilds every August. Scout also produces store-level order recommendations and flags over-ordering from sell-through against orders, which in a set with a fixed end date is where the money is.
The boundary, stated plainly. Scout can hold the item file, maintain cost and retail, push a price file to the POS, and raise and transmit the purchase order against the order guide it holds, so ordering is not the line it used to be. What still needs care is fuel: Scout reads the forecourt as well as the inside store, every figure here is a merchandise number rather than a fuel one, and the two should not be blended.
Related: the confectionery industry read for the velocity curve and the week after, tentpole events, and how to prevent over-ordering in retail.
Frequently asked questions
- When does the Halloween candy season actually start?
- Earlier than the calendar says, and earlier every year. In the 96-store worked example above the seasonal set first scanned in more than half the stores at week minus 10 three seasons ago, week minus 12 two seasons ago and week minus 14 last season, which is the last week of July. The peak stayed fixed to 31 October, so the window is lengthening from the front only.
- Is chocolate losing share of Halloween candy?
- In seasonal packs, yes, and mostly to its own price. Circana reported seasonal chocolate pound sales down 13.7% against non-chocolate up 4.5% in the eight weeks ending 14 September 2025. In the store set above, seasonal chocolate went from 58.4% to 51.9% of seasonal dollars while gummy and chewy went from 25.6% to 30.8%, with chocolate's average selling price up 15.5%.
- Why is my year-over-year Halloween comparison wrong in August?
- Because the set went live earlier this year than last, so one side of the comparison has more selling weeks in it. In the worked example, season to date at the end of August read plus 58% and the season finished plus 7.4%. Align the comparison on weeks since the set went live and the same two seasons read plus 5.4%.
- Which Halloween candy pack format makes the most money?
- The fun-size variety bag carries the most dollars, 46.0% of seasonal sales in the worked example, at the lowest margin rate in the set at 39.5%. The theater box is 13.4% of dollars at 56.5%. The variety bag is also the format that cannot be sold at regular retail after the date, so it is the one to order tight rather than the one to cut.
- How deep do Halloween candy promotions actually go?
- Deeper as the season runs. In the store set above the average depth off regular retail moved from about 12% in the opening weeks to about 27% in the final fortnight, and the mechanic changed from single-item shelf reductions to multi-buys on display. Across the build, 52% of seasonal dollars sold on promotion at a dollar-weighted depth of 24%.
See this on your own data
Scout gives CPG sales teams the analytics infrastructure they need, without spreadsheets.
Get a 15-min demoGet posts like this in your inbox
Retail data, trade promotion, and category management for CPG teams. Roughly weekly. Unsubscribe any time.