
Non-Alcoholic Beverage Trends: The Zero-Proof Set
Non-alcoholic beverage trends usually arrive as a growth rate, and a growth rate off a small base is the least useful number in a category review. The zero-proof set really is growing. It is also under one unit per item per store per week in most sets, which means the interesting questions are all shelf questions: how much space, where, at what price, and in whose basket.
Scope first, because the phrase is overloaded. This page is the zero-proof set inside the beverage-alcohol department: non-alcoholic beer and wine, zero-proof spirits and aperitifs, canned mocktails. Not every drink without alcohol. The functional set is a different shelf with different economics and lives on functional beverages; the whole cooler is on beverage industry trends; the department this one sits in is on alcohol sales trends.
Key takeaways
- January is the sharpest inverse seasonality in the store. In the worked example the zero-proof set runs at index 165 in January while the alcoholic segments run at 72.
- The segment split you report depends on the unit you choose. Non-alcoholic beer is 67% of the set's units and 58% of its dollars in the same stores.
- Placement moves this set more than assortment does. Stores merchandising it inside the beer set sold 12.8 units per store per week against 8.5 in stores using a dedicated bay outside the department.
- It prices above the alcoholic equivalent at every pack, from plus 4% on a craft-style six-pack to plus 27% on a 750 ml spirit, and the widest gap sits on the slowest segment.
- The margin rate makes the shelf argument, not the velocity. At 38.0% against the department's 24.5%, the set earns $3.59 of gross profit per item per week against $2.06 for the alcoholic segments.
What the published non-alcoholic beverage trends numbers measure
The category has more published growth rates than it has shelf feet. Take each with its source, its universe and its period, and separate the measured ones from the surveyed ones before quoting either.
| Source | Figure | Period and universe |
|---|---|---|
| NIQ, reported by BeverageDaily on 17 April 2026 | Non-alcohol beer, wine and spirits passed $1 billion in US off-premise sales, up 22%, at 0.8% of total alcohol; non-alcoholic beer is around 80% of non-alcohol sales and zero-proof spirits around 6%, growing near 70% | 2025, US off-premise retail |
| NIQ, in the same report | 92% of non-alcohol buyers also purchase alcoholic beer, wine or spirits | 2025, buyer-level |
| Brewers Association, 'The State of Non-Alc', 16 January 2026, on NIQ-tracked data | Non-alcoholic was 2.5% of US beer volume in 2025, up from 1.1% in 2021, with volume up 111% and dollars up 159%; 484 brands from 213 producers, against 173 brands from 91 producers in 2021 | 2021 to 2025 |
| Numerator, 22 January 2026, purchase panel plus survey | Alcohol's share of total beverage sales in January fell from 46% in 2022 to 41% in 2025; more than one in four alcohol buyers planned to take part in Dry January 2026 | January 2022 to 2025 panel; survey fielded December 2025 |
| IWSR, reported January 2026 | US no-alcohol beer volumes grew 15% in 2025; global no-alcohol analogue volumes grew 9% | 2025 |
| Gallup, cited by Grocery Dive on 21 October 2025 | The share of US adults reporting that they drink alcohol fell from 62% in 2023 to 54% in 2025 | 2023 to 2025, survey |
Two of those rows are surveys and the rest are measured purchases. The Gallup number is self-reported drinking behaviour, and the Numerator participation figure is a stated intention collected in December about a month that had not happened yet. Both are worth having. Neither belongs in a sentence that starts 'sales of'.
Notice that the brand count grew faster than the category: 173 brands to 484 in four years, against a segment still at 2.5% of beer volume. That makes the assortment decision here a rejection decision rather than a selection one.
Reading non-alcoholic beverage trends: the split depends on the unit
A 38-store grocery and convenience operator, the zero-proof set only, latest 52 weeks, stated per store per week.
| Segment | Items carried per store | Units per store per week | Average retail | Dollars per store per week | Units per item per week |
|---|---|---|---|---|---|
| Non-alcoholic beer | 6 | 7.4 | $8.15 | $60 | 1.23 |
| Non-alcoholic wine | 2 | 1.3 | $9.90 | $13 | 0.65 |
| Zero-proof spirits and aperitifs | 2 | 0.9 | $22.40 | $20 | 0.45 |
| Canned mocktail and zero-proof RTD | 1 | 1.4 | $7.85 | $11 | 1.40 |
| Total zero-proof set | 11 | 11.0 | $9.45 | $104 | 1.00 |
Non-alcoholic beer is 67.3% of the set's units and 57.7% of its dollars. Zero-proof spirits is 8.2% of units and 19.2% of dollars, on two items and a $22.40 ring. NIQ's national read puts non-alcoholic beer at around 80% of non-alcohol dollars and spirits at around 6%; this operator is spirits-heavy against that because it carries two aperitifs in a set of eleven items. Neither number is wrong. They are answers to different questions, and a shelf argument built on the wrong one will over-space the segment with the biggest ring.
The column that should govern the conversation is the last one. The whole set averages one unit per item per store per week, and the canned mocktail line at 1.40 rests on a single item. At those rates a store-level out-of-stock is invisible in a weekly report and a five-week gap reads as a slow item, so watch availability daily. On-shelf availability covers why a low-velocity item is the hardest place to see a void.
Dry January is the sharpest seasonality in the store
Most categories have a season. This one has an inversion. Same 38 stores, dollars per store per week indexed against each line's own 52-week average, with the alcoholic segments of the department alongside for contrast.
| Window | Zero-proof dollars per store per week | Zero-proof index | Alcoholic segments, index against their own average |
|---|---|---|---|
| January | $172 | 165 | 72 |
| February | $115 | 111 | 80 |
| March to May | $95 | 91 | 96 |
| June to August | $99 | 95 | 113 |
| September | $86 | 83 | 95 |
| October | $108 | 104 | 97 |
| November and December | $93 | 89 | 114 |
January runs the zero-proof set at 165 while the rest of the department runs at 72. That 93-point spread is the largest inverse move between two lines of one department anywhere in this store set, and it is pure transaction data: no survey, no panel, no stated intention. October at 104 against the department's 97 is the same effect at a quarter of the size, which is what a moderation campaign with no fixed calendar anchor earns.
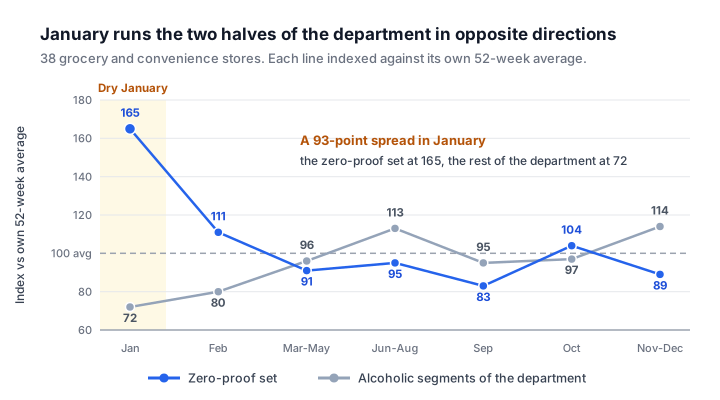
In share terms the set is 2.0% of department dollars across the year and 4.4% in January. That is the number to take into a space conversation: the January rate needs about 1.65 times the facings the annual average justifies, for five weeks, in a department where nothing else is moving. Numerator's panel read agrees on a national universe, with alcohol's share of total beverage sales in January falling from 46% in 2022 to 41% in 2025.
The practical failure is a timing one. The bev-alc reset in most chains lands in the autumn on trailing 52-week data, so the set is sized on a 2.0% share and then asked to deliver 4.4% eight weeks later without a facing change. Either build the January expansion into the reset, or accept that the first week of January is an out-of-stock week and order for it. This category's peak sits on the far side of its own reset. Retail seasonal planning has the general shape.
In the beer set, or in its own bay
This is the placement question the trade press keeps asking and rarely measures. Grocery Dive walked stores in October 2025 and found retailers doing it three different ways: a signed non-alcoholic destination, a printer-paper endcap card, canned water in the wine section. This operator runs two layouts, so the comparison is in the register.
| Placement | Stores | Items | Units per store per week | Units per item per week | Dollars per store per week | Share of zero-proof units sold in a basket that also held an alcoholic item |
|---|---|---|---|---|---|---|
| Inside the beer set | 22 | 11 | 12.8 | 1.16 | $119 | 61% |
| Dedicated bay outside the department | 16 | 11 | 8.5 | 0.77 | $83 | 34% |
| All stores | 38 | 11 | 11.0 | 1.00 | $104 | 52% |
In-set stores sold 51% more units per store and 1.5 times the units per item on an identical eleven-item assortment. Before anyone reprints that as a rule: the two groups were not randomly assigned. The operator put the dedicated bay in its smaller-format stores, where the alcohol department is smaller too, so part of that gap is the store rather than the fixture.
The version that survives scrutiny is a within-store move. Six stores relocated the set from the bay into the beer set mid-year. In the 13 weeks after the move their units per item went from 0.81 to 1.09, up 35%. Over the same 13 weeks the stores that did not move went from 0.83 to 0.86, up 3.6%. A 31-point difference on a matched period is a placement effect, and it is worth more than any assortment change available in an eleven-item set.
The attachment column says why. In the beer set, 61% of zero-proof units left in a basket that also held an alcoholic item; in the dedicated bay, 34%. The bay is not reaching a different shopper so much as missing the one already standing at the cooler. If licence or layout forces a separate bay, the fix is a duplicate facing in the beer set rather than better signage on the bay. Shelf space optimization covers funding it.
The price gap against the alcoholic equivalent
Zero-proof prices above the thing it replaces, at every pack in this set. Average shelf price across the 38 stores, each zero-proof pack against the nearest alcoholic equivalent the same stores carry.
| Pack | Zero-proof average shelf price | Nearest alcoholic equivalent | Difference |
|---|---|---|---|
| Six-pack, 12 oz, mainstream | $10.49 | $9.79 | +7.1% |
| Six-pack, 12 oz, craft style | $12.99 | $12.49 | +4.0% |
| 750 ml still wine | $14.99 | $12.99 | +15.4% |
| 750 ml spirit or aperitif | $27.99 | $21.99 | +27.3% |
| Four-pack, 355 ml, ready to drink | $11.99 | $10.99 | +9.1% |
The gap is widest exactly where velocity is weakest. Zero-proof spirits price 27.3% above the mid-tier 750 ml and turn 0.45 units per item per week; the craft-style six-pack prices 4.0% above its equivalent and turns 1.23. That ordering is worth testing rather than assuming, because price is the one lever here a retailer controls directly. The production cost behind the premium is a supplier question a register cannot measure.
There is a real counter-argument to closing the gap, and it wins the shelf. The zero-proof set runs a 38.0% gross margin in these stores against 24.5% for the alcoholic segments, which are priced for a far more comparison-shopped basket. Eleven items turning $104 a week at 38.0% is $3.59 of gross profit per item per store per week; the alcoholic segments turn about $5,200 across roughly 620 items at 24.5%, which is $2.06. Run the space debate on units and this category always loses it. Run it on gross profit per item and it wins by 1.7 times, and GMROI is the version that survives a finance review, because it puts the inventory investment back in.
Basket attachment: is the zero-proof buyer also the alcohol buyer
Same 38 stores, per store per week, every basket containing at least one item from the beverage-alcohol department. The ring is the whole basket, not the department line.
| Basket | Baskets per store per week | Zero-proof units carried | Average basket ring |
|---|---|---|---|
| Alcoholic item only | 1,171 | 0 | $41.20 |
| Both alcoholic and zero-proof | 5 | 5.7 | $57.60 |
| Zero-proof only | 4 | 5.3 | $19.80 |
| All department baskets | 1,180 | 11.0 | $41.20 |
52% of zero-proof units left the store in a basket that also held an alcoholic item. That is a trip-level fact and the one a retailer can act on: the two sets meet the same shopper on the same visit, so they should sit within reach of each other.
Set that against NIQ's finding that 92% of non-alcohol buyers also purchase alcoholic beer, wine or spirits. Both are true and they are not the same claim: NIQ follows households across a year, the register sees one trip. The household figure argues this is a moderation category rather than an abstinence one; the trip figure argues for the placement decision above. A deck that quotes 92% to justify a fixture is using a household instrument to answer a shelf question. Household panel data sets out what each one can carry.
One number there needs a caveat before anyone reprints it. The both-basket ring of $57.60 against $41.20 is 40% higher, and most of that is arithmetic rather than a halo: a basket with an extra item rings higher by construction. What these rows defensibly show is the attachment rate, and the zero-proof-only trip at 4 baskets and a $19.80 ring, which is a genuinely smaller visit. Market basket analysis separates the two.
What this read cannot tell you
A register records an item, a price, a time, a store and a basket. It records no person. So nothing in this category's most-quoted narrative is available from point of sale: not whether a shopper is abstaining or moderating, not whether they are pregnant, in recovery, medicated, driving, or out of the mood. Not their age. Not whether Dry January was a resolution or a coincidence.
The temptation is strong here because the category is sold on a story about behaviour change, and the Gallup and Numerator figures above are the shape of evidence that story wants. They are surveys, quoted here as surveys, describing a national population rather than your stores. The defensible sentence from a register is 'zero-proof dollars ran at index 165 in January against the set's own 52-week average while the alcoholic segments ran at 72'. Everything about why needs loyalty-linked demographics or a panel. Syndicated versus panel data covers which instrument answers which question.
A shelf plan for the zero-proof set
- Report the set on units per item per store per week, never on category growth rate. A 22% growth rate on 1.00 units per item is a rounding error dressed as a trend.
- Size January separately from the year. A set built on a 2.0% department share will be short in the month it holds 4.4%, and the reset that sizes it happens before the peak.
- Put it in the beer set. If layout or licence forbids it, duplicate a facing there rather than improving the signage on the separate bay.
- Run the space argument on gross profit per item, not on units. On units this category loses every review it enters.
- Treat the assortment decision as a rejection decision. There are 484 brands and eleven facings, so the test is units per item after the addition, not the new item's own velocity.
- Watch availability daily. At one unit per item per week a weekly report cannot distinguish a void from a slow seller, and the two need opposite responses.
How Scout fits
Scout reads store-level point of sale directly and holds item, price, promotion, margin, store group and basket in one model, so the reads above are cuts rather than projects: a seasonality index by segment, a placement comparison with a before-and-after on the stores that moved, a price ladder against the alcoholic equivalent, and an attachment rate by fixture. For a set this small that matters more than it sounds, because each cut is a handful of units a week and a spreadsheet rebuild never gets run often enough to catch it.
Two boundaries, stated plainly. Scout models the assortment and space decision, measures what a placement change did, and can publish the shelf layout that comes out of it. What it cannot do is tell you why a shopper reached for the zero-proof six-pack, because Scout reads transactions rather than people. And for an operator who also sells fuel, Scout reads the forecourt too, but they are separate instruments: everything here is a merchandise and foodservice number.
Related: alcohol sales trends for the department this set sits in, what BWS means and how the category splits, and SPINS for beverage and the alcohol / non-alcohol split for how the syndicated view draws the same line.
Frequently asked questions
- How big is the non-alcoholic beverage category?
- NIQ reported non-alcohol beer, wine and spirits passing $1 billion in US off-premise sales in 2025, up 22% and at 0.8% of total alcohol. The Brewers Association, on NIQ-tracked data in January 2026, put non-alcoholic at 2.5% of US beer volume in 2025 against 1.1% in 2021. In the 38-store worked example above it is 2.0% of department dollars.
- Is Dry January visible in retail sales data?
- Sharply. In the store set above the zero-proof line ran at index 165 in January against its own 52-week average while the alcoholic segments ran at 72, and the set's share of department dollars went from 2.0% for the year to 4.4% in January. Numerator's purchase panel shows alcohol's share of total beverage sales in January falling from 46% in 2022 to 41% in 2025.
- Should non-alcoholic beer sit in the beer aisle or its own section?
- In the beer set, on this evidence. Stores merchandising it inside the beer set sold 12.8 units per store per week against 8.5 in stores using a dedicated bay, on an identical assortment. The cleaner test is the six stores that moved mid-year: units per item went from 0.81 to 1.09 in the following 13 weeks while non-moving stores went from 0.83 to 0.86.
- Do non-alcoholic buyers also buy alcohol?
- Usually, and the two available answers measure different things. NIQ reports 92% of non-alcohol buyers also purchase alcoholic beer, wine or spirits, following households over a year. In the store set above, 52% of zero-proof units left in a basket that also held an alcoholic item, which is one trip. Use the first for category strategy and the second for placement.
- Why does non-alcoholic beer cost more than regular beer?
- Whatever the reason, the register confirms the gap. In the 38-store set the zero-proof pack prices above its nearest alcoholic equivalent at every format, from plus 4.0% on a craft-style six-pack to plus 27.3% on a 750 ml spirit. The production cost behind that premium is a supplier question point-of-sale data cannot answer.
See this on your own data
Scout gives CPG sales teams the analytics infrastructure they need, without spreadsheets.
Get a 15-min demoGet posts like this in your inbox
Retail data, trade promotion, and category management for CPG teams. Roughly weekly. Unsubscribe any time.